What is a Bar Graph
A Bar Graph is a chart that is used to show information called DATA by using bars of different heights or lenghts
GRAPH is commonly represented by charts. It is a graphical representation of data which shows the connection between two variables that help us understand amounts, by means of a line, a curve, series of bars or other symbols.
This two variables are the independent variable which is the x-axis (the horizontal line), and the y-axis (vertical line). And these two variables are intersected in a point called origin.
For better understanding, refer to the image below:

Shown in the illustration is a graph, any point lying in the y axis is a y vertex, and any point lying in the x axis is called x vertex. And these points will be called as vertices in the form (x, y).
This will be used to make graphs. Therefore, the origin has vertices of (0, 0)
There are different types of Graphs however, the most popular ones are
- Bar Graph
- Line Graph
- Histogram
- Pie Chart
In this section, we will be discussing the first classification of graph, the BAR GRAPH;
Bar Graph is a graph or chart that represents a grouped data with rectangular bars with lengths proportional to the values that they represent. There are four types of Bar Graphs:

Horizontal Bar Graph – The bars are horizontal which means that the taller the bar, the larger the category.
This is a particularly effective way of presenting data when categories have long titles, or when there are large numbers of different categories.
Shown is a sample of horizontal graph.
Vertical Bar Graph – The bars are vertical also called as Column Bar Graph. The higher the vertical bar is, the higher the value is.
Commonly, this represents only a single value for both the y and x axis.


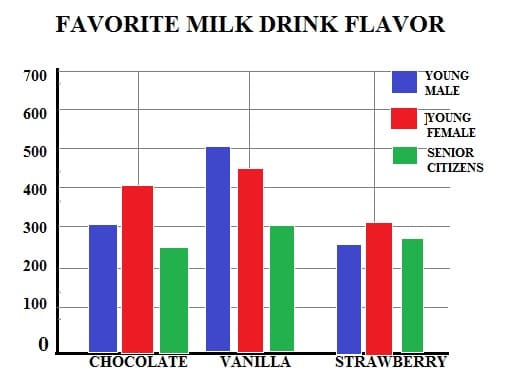
Grouped Bar Graph – Grouped bar charts are a way of showing information about different sub-groups of the main categories.
Shown in the graph is favorite ice-cream flavor. Voted by: Blue – Students, Red – Professionals, and Green – Children
Stacked Bar Graph – Stacked bar are similar to grouped bar charts in that they are used to display information about the sub-groups that make up the different categories.
In stacked bar graphs the bars representing the sub-groups are placed on top of each other to make a single column, or side by side to make a single bar.
The overall height or length of the bar shows the total size of the category.

Test your knowledge on What is a Bar Graph
