What is a Pie Chart
A pie graph is a circular statistical graph which is divided into slices to illustrate numerical proportions. Normally a pie chart represents a whole or a total of 100% if all sectors were added.
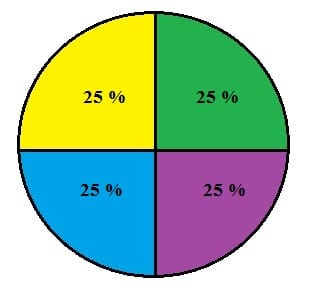
See below a sample of a pie chart:

Shown in the sample is a PIE CHART. The graph is divided into 4; each division is what we call as SECTORS.
Since a graph represents a 100%, which means each sector has been equally divided into 25% each
In our everyday living, we can actually use pie charts to determine how much we spent, how much time did we consume for a certain activity, and how can we budget things up.
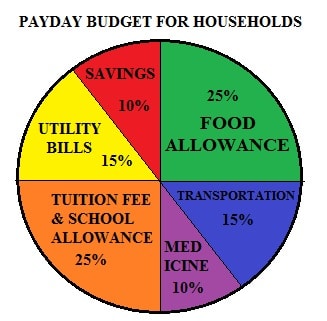
To give you an example, shown is a graph below together with its interpretation.
Shown in the left is the payday budget of a household. These consist of:
Food Allowance – 25%
Transportation – 15%
Medicine – 10%
Tuition Fee & School Allowance – 25%
Utility Bills – 15%
Savings – 10%

Using the illustration, if the household father has a salary of $400.00, let us compute for the allocation of each sector in the pie graph:
Food Allowance 25% x $ 400.00 = $ 100.00
Transportation 15% x $ 400.00 = $ 60.00
Medicine 10% x $ 400.00 = $ 40.00
Tuition Fee & School Allowance 25% x $ 400.00 = $ 100.00
Utility Bills 15% x $ 400.00 = $ 60.00
Savings 10% x $ 400.00 = $ 40.00
TOTAL $ 400.00

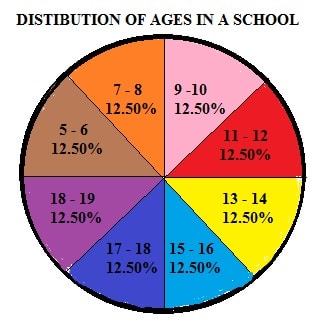
Shown in the illustration is the distribution of ages in a School. Ages are from 5 years old to 19 years old. As seen in the chart, there is an equal distribution of ages in the school. All 8 sectors has an equivalent of 12.50% age distribution.
If there are 2,000 students in the school. How many students are there in each age sector?
To compute, that is 2,000.00 x 12.50% is equivalent to 250 students each.
Test your knowledge on Pie Charts

Awesome